

Appearance
Reports
Reports is one page with six sections over the last 7, 30 or 90 days: headline numbers, decoration method mix, margin, labour on jobs, sales commission and top customers. Every figure is calculated from your own records at the moment you open the page.
Where It Lives
| Page | What it's for |
|---|---|
| Insight, then Reports | The page itself, with 7 days, 30 days and 90 days at the top |
| Records, then Customers, then a customer, then Export activity (CSV) | The export of one customer's history |
Reports are available to owners, managers, the sales role and the finance role; the viewer role can read them.
Choosing the Window
Click 7 days, 30 days or 90 days at the top of the page. The selected button is highlighted and every section recalculates for that window, counted back from today.
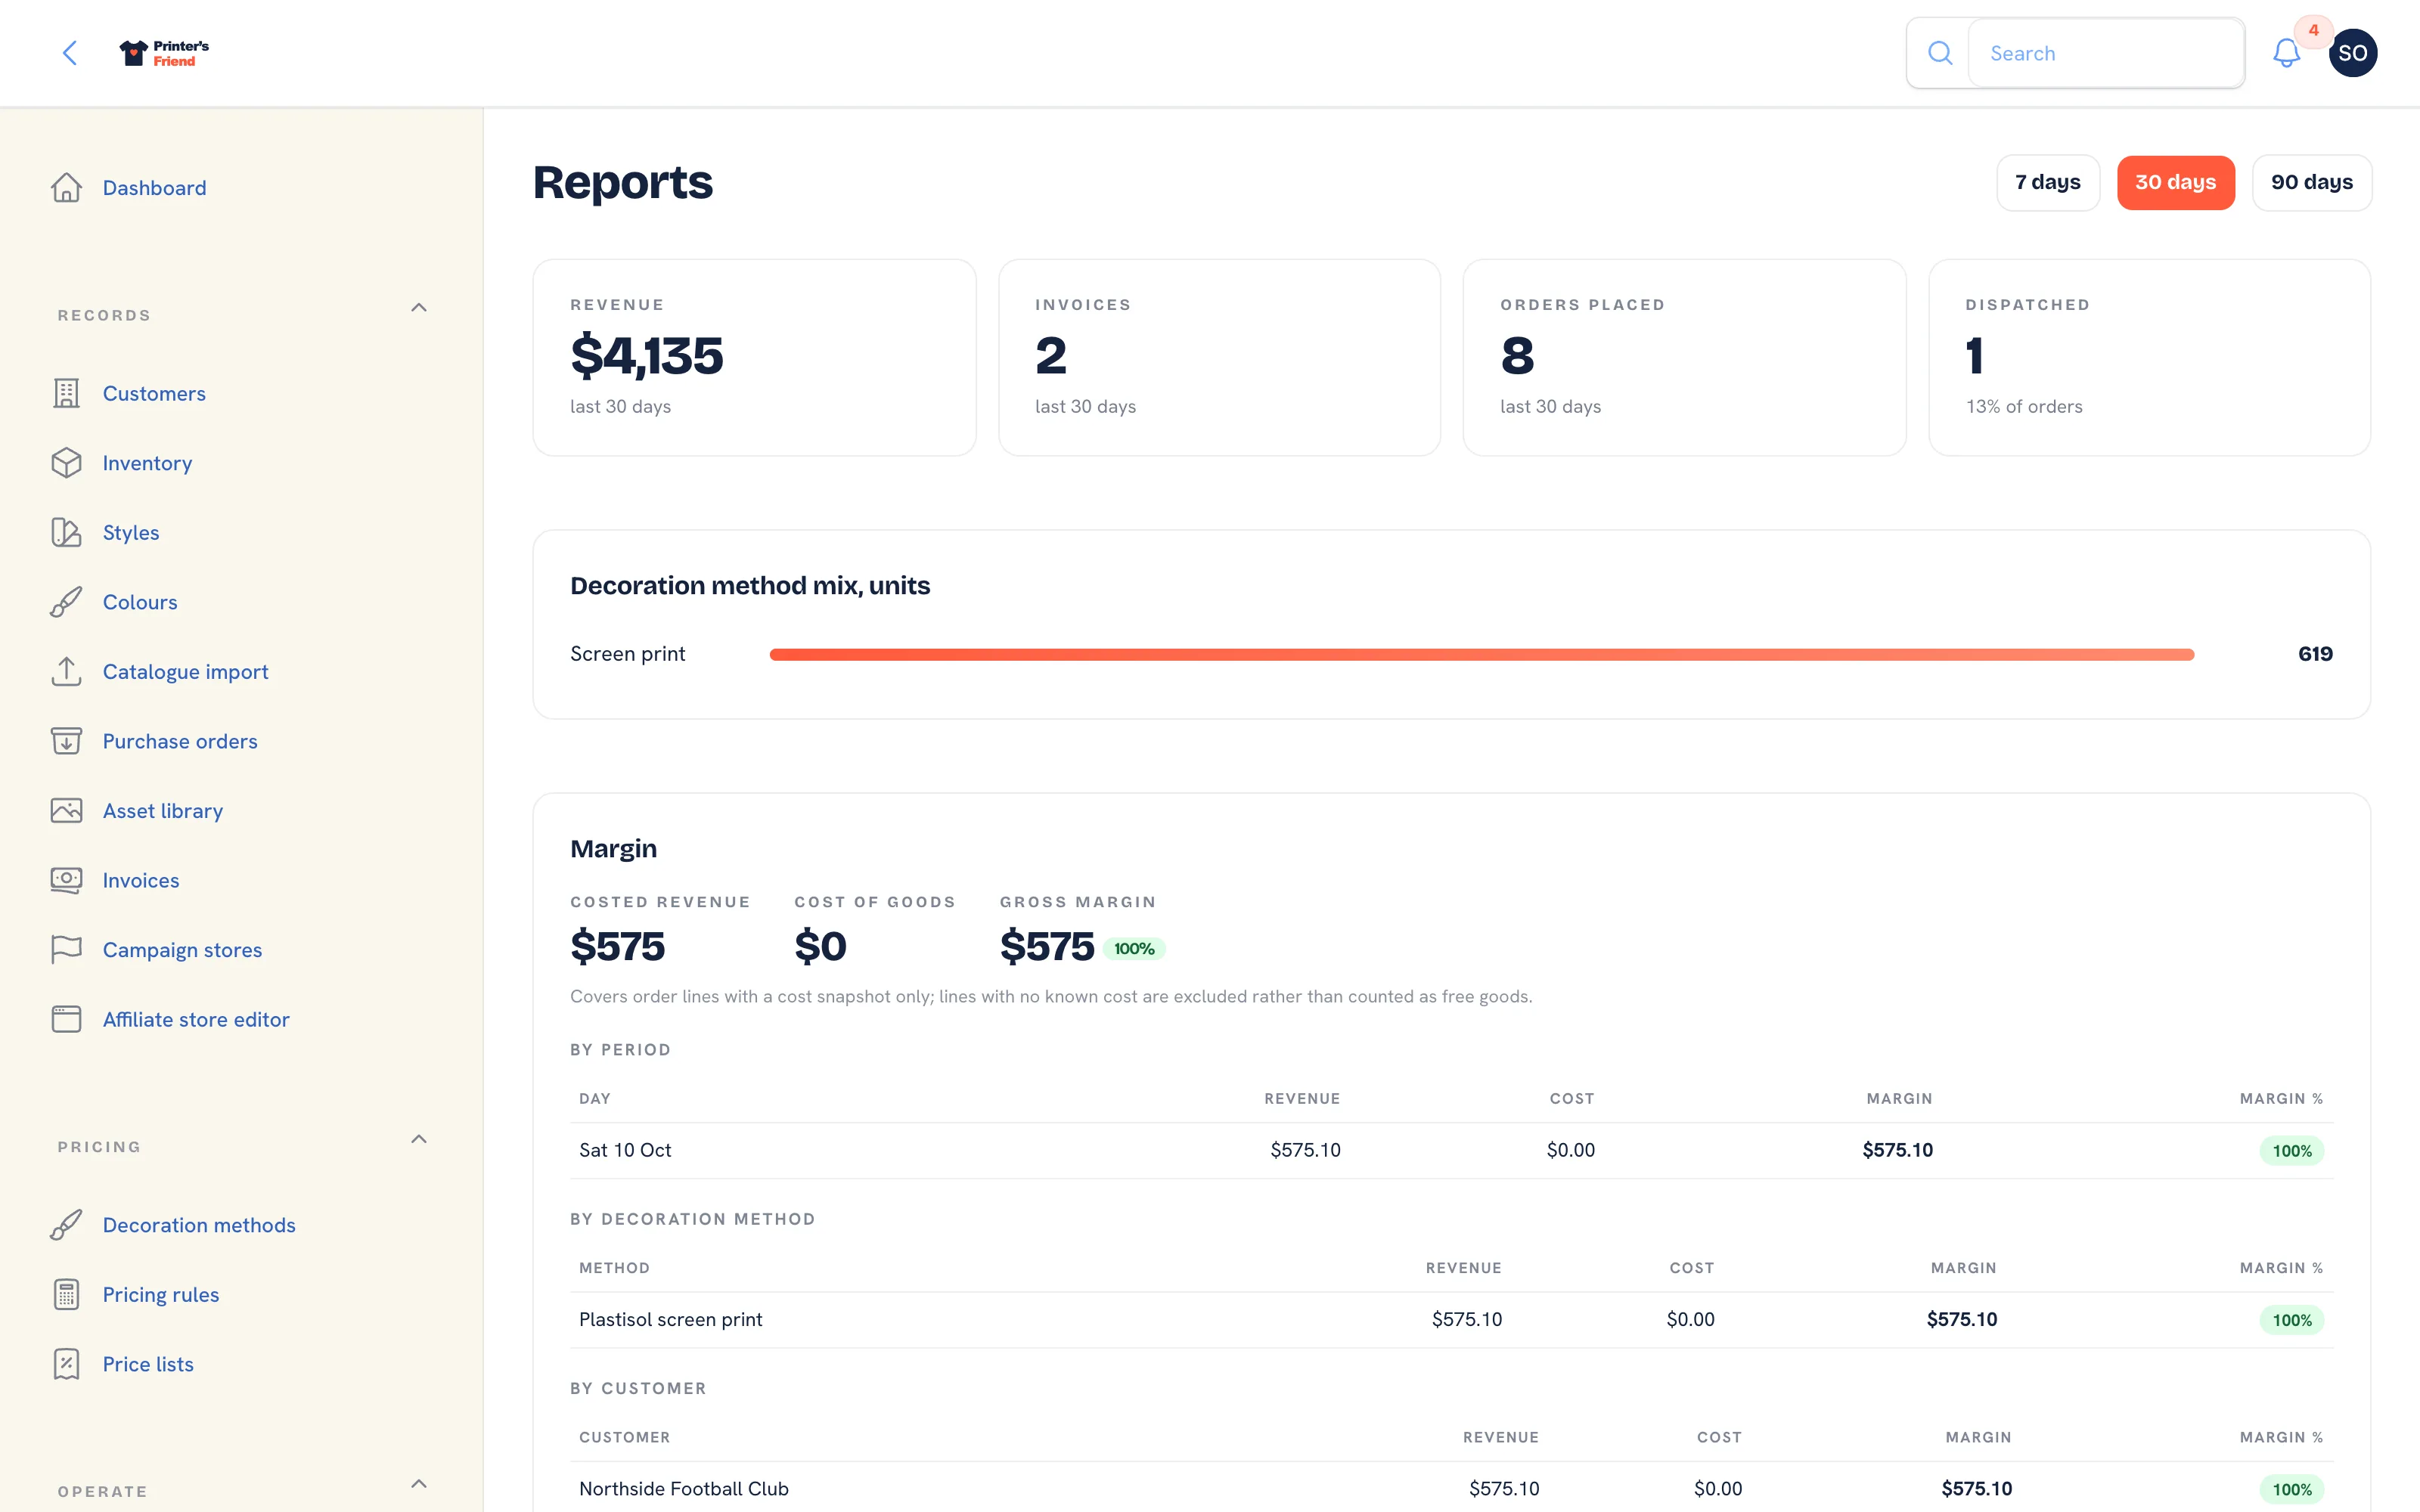 Reports, top of the page.
Headline Tiles
Revenue is the total of invoices issued in the window, tax inclusive. Invoices counts them. Orders placed counts orders created in the window, and Dispatched counts how many of those have reached Dispatched, with the percentage underneath.
Decoration Method Mix
Units by decoration method for order lines created in the window, as bars. Lines with no method are grouped as Unspecified. This is the section that shows what your shop produces, which is not always what it sells itself as.
Margin
Margin comes from the cost snapshot written onto each order line when a quote is accepted: the supplier cost on the SKU and the decoration cost estimate. The section shows Costed revenue, Cost of goods and Gross margin with a percentage pill, then three tables: By period (one row per day), By decoration method and By customer (the top ten by revenue). Cancelled orders are excluded.
Lines with no cost snapshot are left out, not counted as free goods, so costed revenue can be lower than the revenue tile. When the section says there are no costed order lines in the range, add supplier costs to your SKUs under Catalogue and SKUs and cost estimates to your decoration methods; margin then appears for quotes and orders created from that point.
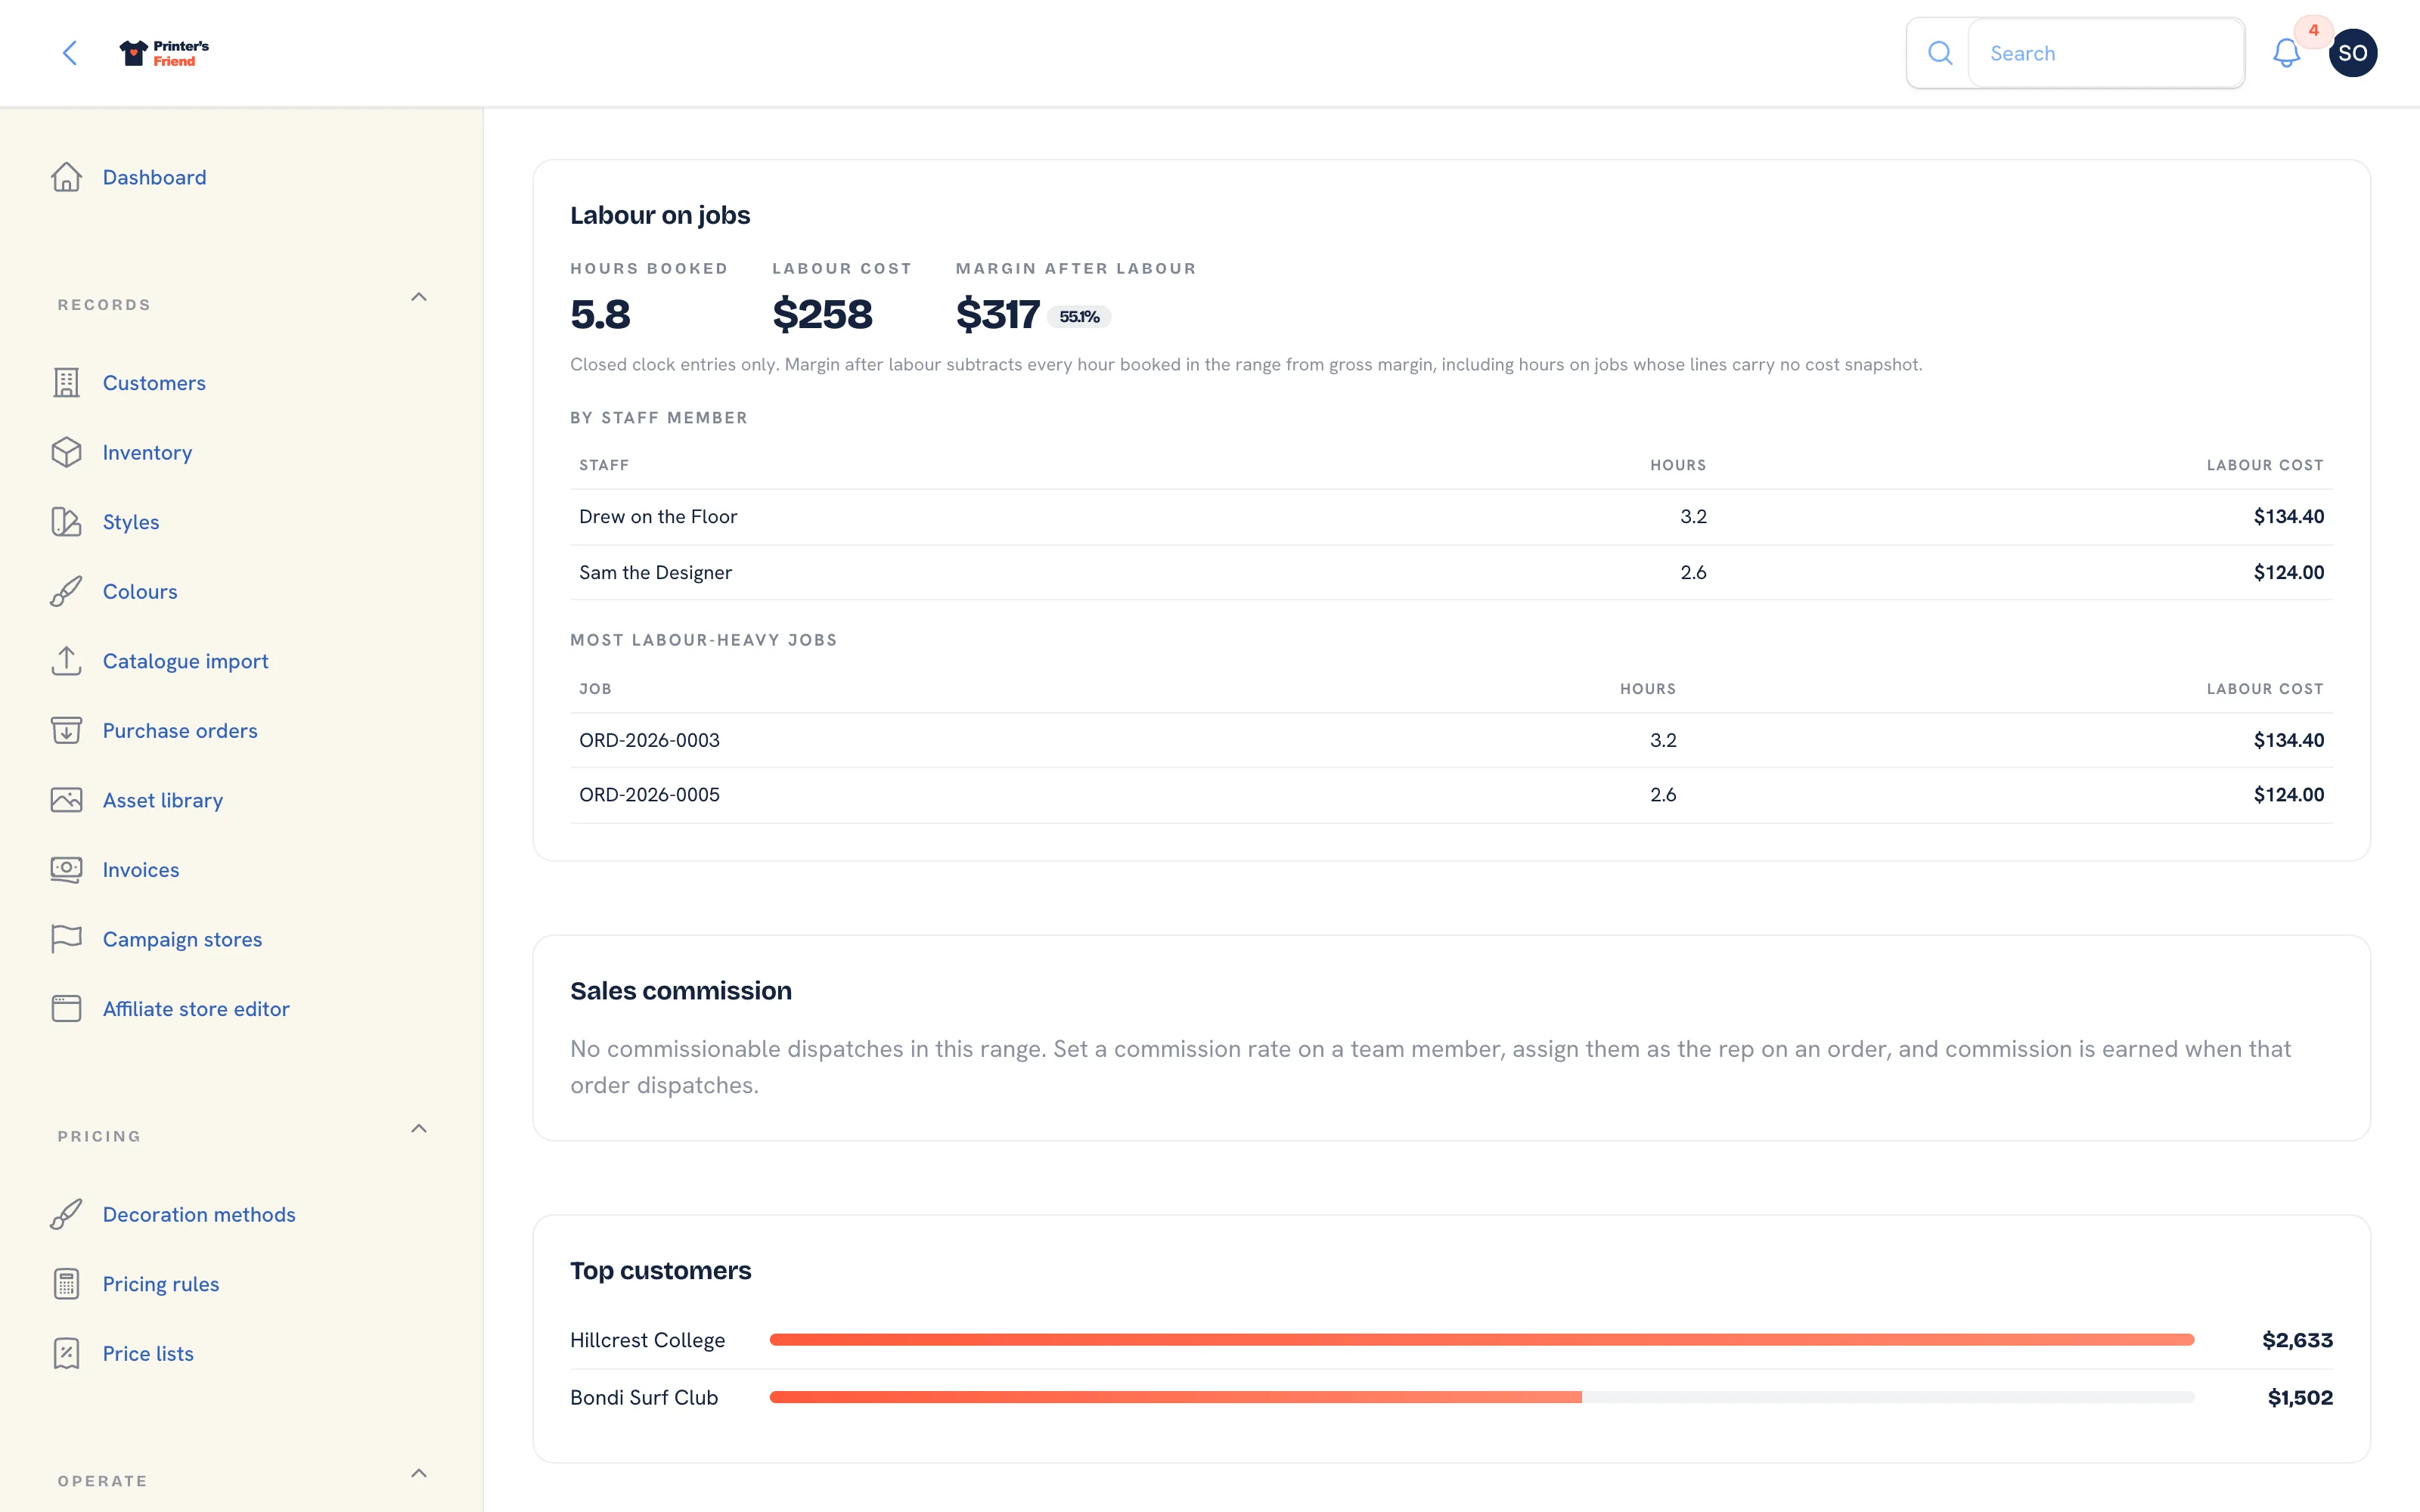 Reports, the lower sections.
Labour on Jobs
Hours booked and Labour cost from closed time clock entries that started in the window, costed at each person's labour rate from their team record. Margin after labour subtracts that cost from gross margin, including hours on jobs whose lines carry no snapshot, so it is a conservative figure. Two tables follow: By staff member, and Most labour-heavy jobs, the ten orders with the highest labour cost. See Time on jobs for the clock itself.
Sales Commission
Commission owed for the window, then a row per rep with the number of orders, the ex-tax value and the commission. Commission is earned when an order dispatches, on the ex-tax order value, at the rate frozen onto the order when the rep was assigned. With no commissionable dispatches, the section says so and explains how to set a rate.
Top Customers
The ten organisations with the most invoiced revenue in the window, as bars.
Getting Numbers You Can Act On
- Put supplier costs on SKUs and cost estimates on decoration methods, or margin stays empty.
- Put a labour rate on each team member, or clocked hours cost nothing.
- Have staff clock on and off at the floor station, or there are no hours to cost.
There is no CSV export on this page. One customer's history exports from their customer record, and the REST API exposes orders, customers and inventory on Premium and above.
Related Pages
- Dashboard: the morning view: late jobs, proofs waiting on customers, cash and capacity
- Time on Jobs: clock staff on and off jobs and cost the hours
- Catalogue and SKUs: import brands, styles, colourways and SKUs from a CSV
- Decoration Methods: the rate matrix and setup fee for each method
- Team and Permissions: roles, rates, deactivating leavers and the owner rules
- Customers: the customer record, contacts, portal logins and addresses